


The Manhattan Butt Map
The New York Philharmonic subscriber list circa 1870-2015, residential dynamics of cultural change, and the ways that quantitative research can still have qualitative bones

Once upon an 8 years ago in an Ontario town far, far away, I was working on a Master’s project that attempted to trace the shadows of “invisible” members of Toronto society through turn-of-the-century records. This research was worth doing in part because of the nature of data from that era. It was handwritten and often influenced by the people recording the data, and there were lots of types of institutions (public, religious, and private) that would gather it, analyze it, store it, and apply it.
Census records were a particularly enchanting site for this work, since the “door knockers,” as they were called, would ask for household members’ ages, professions, relationships to each other, and other aspects of life and identity, recording what their interviewees told them. When someone made their living by illegal means, or they were living in a situation that might draw the attention of the morality police, what they told census-takers was not the truth. But what they told census-takers was still what you would call “good data,” since patterns of these people’s lives could still be mapped using both quantitative (by the numbers) and qualitative (by the themes) methods.
And all of this brings us to today. We’re gonna do a little case study on how one research study out of Columbia University took a subscriber register of the New York Philharmonic in the late 1800s and literally mapped the class composition of social elites onto the residential geography of Manhattan. Then we’ll look at some other places where this types of research show up in weird and cool ways, like looking at early spectator sports and a prolific boat-builder on the Thames. With the right lens, knowing what butts are in what seats when can really illuminate some social realities.
Okay. Vanderbilts and Rockefellers! Upper West Side vs Upper West Side! Downtown vs Uptown! Mets vs Yankees! Other New York words! Let’s go!
Style note: I wrote this piece as a podcast episode for my research methods class. It’s laid out a little differently and will be less laden with tangents for this reason!
If you’d like to listen to me read it, you can do that here:
Welcome to Study Hall, the podcast that buys symphony tickets one at a time and is therefore invisible to researchers.
Today we’re talking about mixed methods research and the power of overlaying qualitative data onto quantitative data to make it make sense.
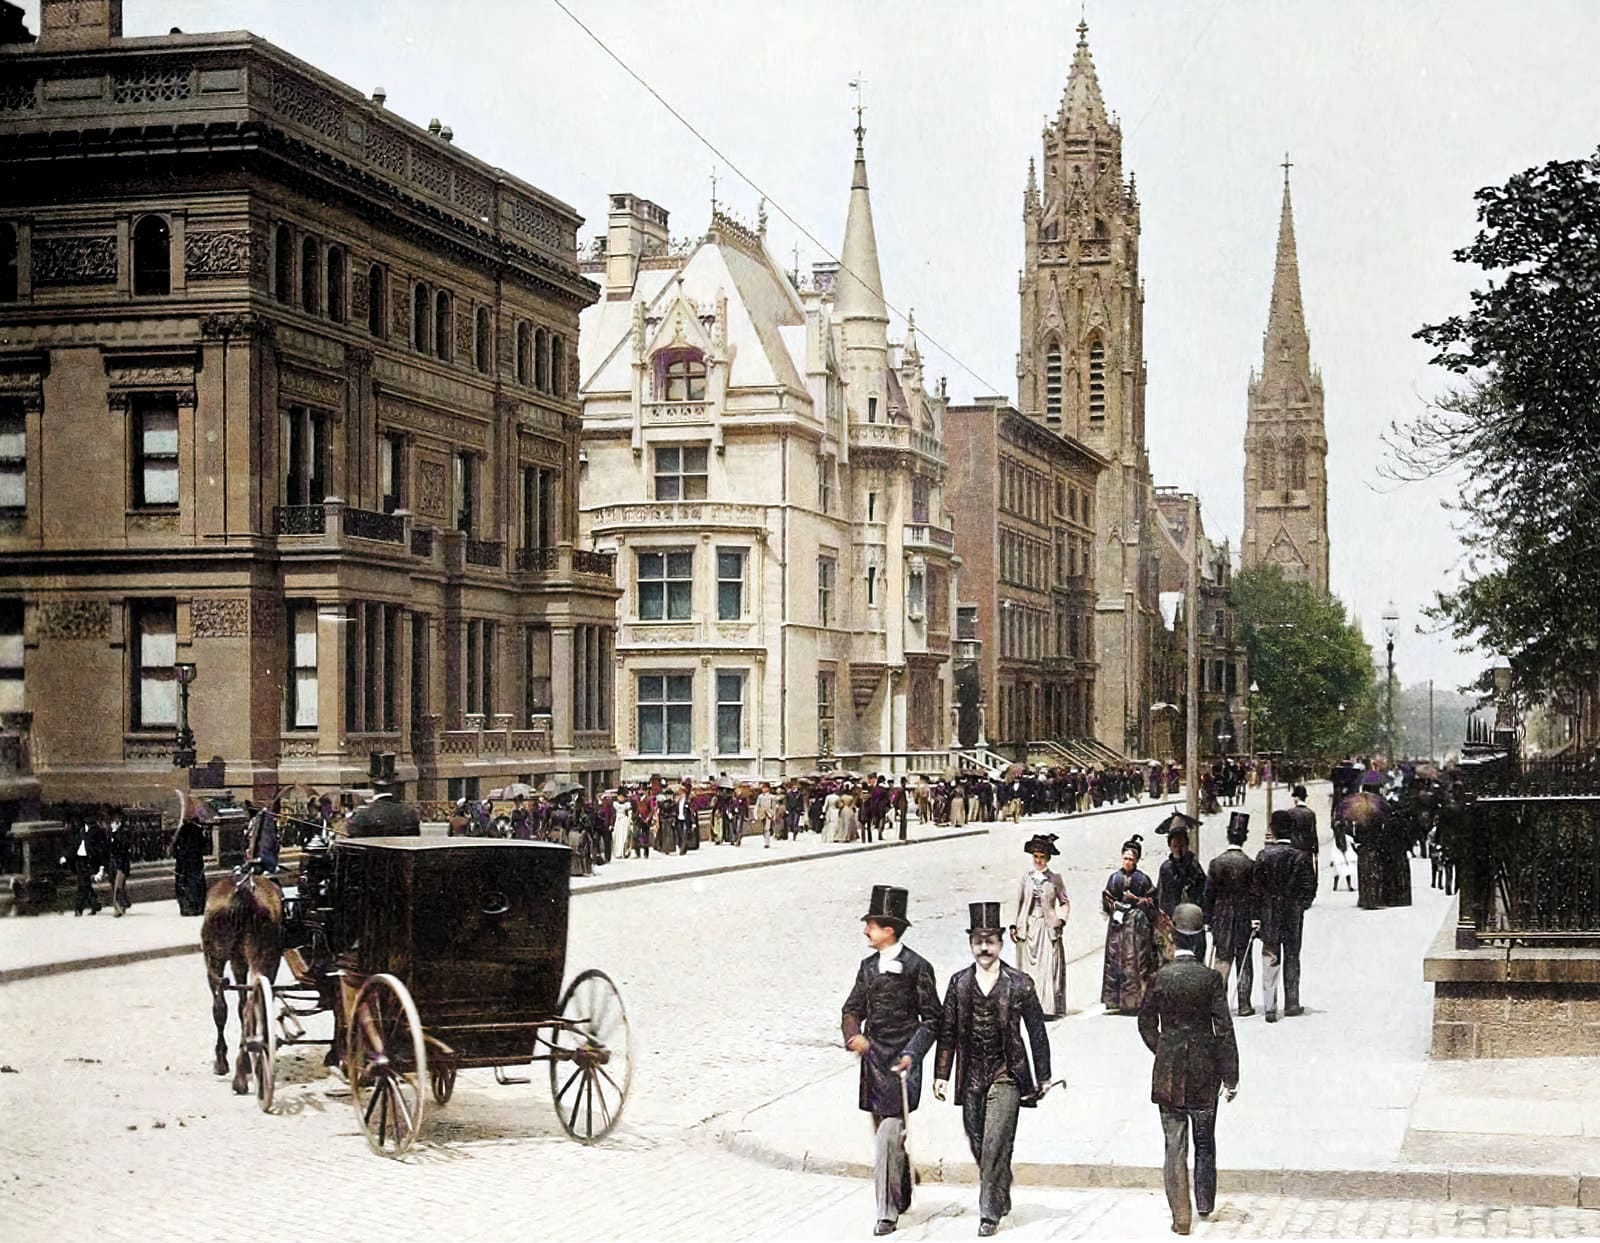
Elite New Yorkers during the second half of the 19th century were a pretty homogenous bunch - largely white Anglo-Saxon Protestant and usually bankers, lawyers, and merchants. They lived on the Upper East Side in grand Gilded Age mansions, with their names on the prestigious New York Social Register. Many of them also held ticket subscriptions to the New York Philharmonic, which brings us to our story.
Dr. Shamus Khan is a sociologist and professor at Columbia University. He appeared on the June 5th, 2015 episode of the podcast Give Methods a Chance to share his work on the New York Philharmonic historical records digitization project. The New York Phil brought him on to dig into their data in search of anything of interest to the research world, and so Khan developed a few questions to answer using their old ticket subscriber data.
These questions are: Who has been going to the New York Philharmonic since 1870? How do these patronage patterns change over time? Can we define a class of social elites based on cultural participation criteria?
He set out to answer these questions by first using quantitative methods. Taking the primary data present in the list of ticket subscribers, he could see who purchased tickets and where they lived. The problem with these data points was that they mean nothing without context - what does it mean that someone lived at 5th Ave and E 59th compared to 5th and E 22nd? Even the list of names posed a problem. Khan was already working with an established sample of cultural and economic elites, but not all elites were subscribers to the New York Phil, and as he came to learn, not all subscribers were elites in the same way as others.
Ticket subscribers are a specific group of ticket holders. To be on the subscriber list, a person must purchase tickets for more than one event at a time. If I was a New Yorker in 1894 and I purchased tickets for myself and my spouse for a night of Beethoven in December at Carnegie Hall, I wouldn’t make it onto the subscriber register regardless of my wealth or social status. If I purchased those tickets and another pair for a Dvořák performance in January, I’d be visible to researchers today. So the limitations of the data require additional context to answer the research questions posed by the team.
To add to what he was working with, Khan turned to other sources of data to establish themes in cultural dynamics among elites and emerging subgroups. These were census records, New York Times editorials, and the New York Social Register, a list of the most prominent 0.1% of New Yorkers in terms of wealth and influence. Thanks to access to broader themes and personal accounts of class-specific interactions, Khan and his team determined that their previous assumptions about Gilded Age class organization wasn’t as clear-cut as they’d thought.
They found that economic class composition was congruent with trends in census-sourced professions and income levels, and those patterns were visible in the New York Philharmonic’s subscriber lists. But - their initial assumption that they would run into evidence of class consolidation, a phenomenon where elites become a more homogenous group in terms of cultural participation, ended up being false.
The project mapped the collision of economically dynastic families like the Vanderbilts and Rockefellers with the new class of cultural elite like public intellectuals in the arena of Carnegie Hall. As it turns out, the ways that social mobility can be traced by residential dynamics in Manhattan is represented in the microcosm of orchestra seating. The seating map constructed an account of place for the nouveau riche, who took up an increasing proportion of subscription tickets over time, and whose addresses were moving further north, establishing the Upper West Side as a landing place for the subgroup of newly upper class, largely Jewish families.
The expectation of seeing established elite continuing to sit together separate from new subscribers was refuted by the qualitative evidence. First-person accounts reflected less of an exclusionary brand of class consolidation and more of an inclusive one, where the influx of new patrons of the Philharmonic are themselves altering the seating map by entering the cultural space to begin with. The same is true for uptown residential dynamics. It’s not that established economic elites don’t allow class ascenders to move to the Upper East Side, it’s that the growing population of cultural elites is establishing its own geographic patterns.

Strategies like Khan’s are also present in other research using historical data. When John K. Walton was completing his 2007 study of the early Spanish football hub of San Sebastián, he used economic and population data from the early 20th century to trace the growing game. There was heavy investment in the stadium in 1920-23, a time when the population was in the midst of growing by 60% between 1910 and 1930. In 1914, maximum capacity was 1200 spectators and, according to Walton, that cap was rarely met. The new 18,000-seat Atocha stadium was the product of private and public investment and would be the home of Real Sociedad for 80 years.
So why the big change? What Walton found was a pattern of British influence in the Basque seaside town, both in football as a popular pastime and in the summertime migration of aristocracy to the coast. Queen Regent María Cristina famously spent every summer but one in San Sebastián between 1887 and 1929, bringing politicians, social elites, and the royal court along with her. Being close to the popular British destination spot Bilbao also had an influence over cultural shifts, since that’s likely a significant entry point for popular British leisure. The resulting confluence of wealth, power, and an appetite for British-style entertainment proved to be a primary driver for successful spectator sport in northern Spain.
Simon Wenham’s dissertation on the Salter Bros company, prolific watercraft builders on the river Thames from 1858 to 2010, also takes a mixed methods approach. He builds on sales records and tax documents with data on the social conditions around the Thames that drove the company up to peaks and down to valleys over 160 years. The mix helped to reveal why, for example, sales of racing craft boomed in the 1860s (a contract with Oxford University) and why their collapsible lifeboat sales spiked in April 1912 (the month of Titanic’s sinking).
As the decades wore on, Salters shifted into pleasure craft leasing and passenger travel. Wenham is able to correlate these business adaptations to stratification of working and middle class that created further uptake of leisure activities. The down years of the 1960s run parallel to Oxford’s industrialization and the arrival of the car industry that Wenham credits for siphoning skilled labour from the local workforce.
The more context can be uncovered, the more sense the rest of the data will make. Like in San Sebastián and Oxford, Manhattan had more to discover in its records than was obvious at the outset of research. The seating charts at Carnegie charted the rise of an updated social hierarchy in the same manner as professional ranks and street addresses.
I think there are lots of reasons to stick with a single research methodology, but when the quality of data can be improved, like added social context to economic change, stepping from descriptive research into predictive research can be achieved with a mixed methods approach. As we’ve learned today, the conclusions can be molto fortissimo.
Thanks for joining me on this research methods journey! I can’t say I’d jump at the chance to listen to my own voice for that long again, but I had fun unpacking the nuances of these studies.
Catch ya later!